

The drewry world container index oct 2025 marked a pivotal shift in global shipping dynamics. Experts watched closely as freight rates began to stabilize after months of declines. This index, a benchmark for container shipping costs, reflected emerging pressures from trade routes and supply chains. Businesses relied on these figures to plan budgets and strategies. In October 2025, the index showed early signs of recovery, influencing decisions across industries.
Shipping leaders use the Drewry World Container Index to gauge market health. It tracks spot rates for 40-foot containers on major routes. October brought notable changes, ending a long streak of drops. Rates climbed modestly, signaling potential stability ahead. This article breaks down the details, offering clear insights for professionals in logistics and trade.
What Is the Drewry World Container Index?
Drewry, a leading maritime research firm, created this index to measure container freight rates. It helps stakeholders understand cost fluctuations in real time. The firm gathers data from key trade lanes worldwide.
Experts assess rates weekly, focusing on eight major routes. These include paths from Asia to Europe and the Americas. The composite score averages these figures, providing a snapshot of global trends.
Drewry ensures accuracy by consulting carriers and market sources. They exclude special surcharges, keeping the focus on base rates. This approach makes the index reliable for contracts and forecasts.
Many companies link their agreements to this index. It protects against sudden price swings. In volatile times, such as post-pandemic recovery, it becomes essential.
The index started in 2011, responding to growing trade complexities. Since then, it has guided billions in shipping deals. Users appreciate its transparency and timely updates.
History of the Drewry World Container Index
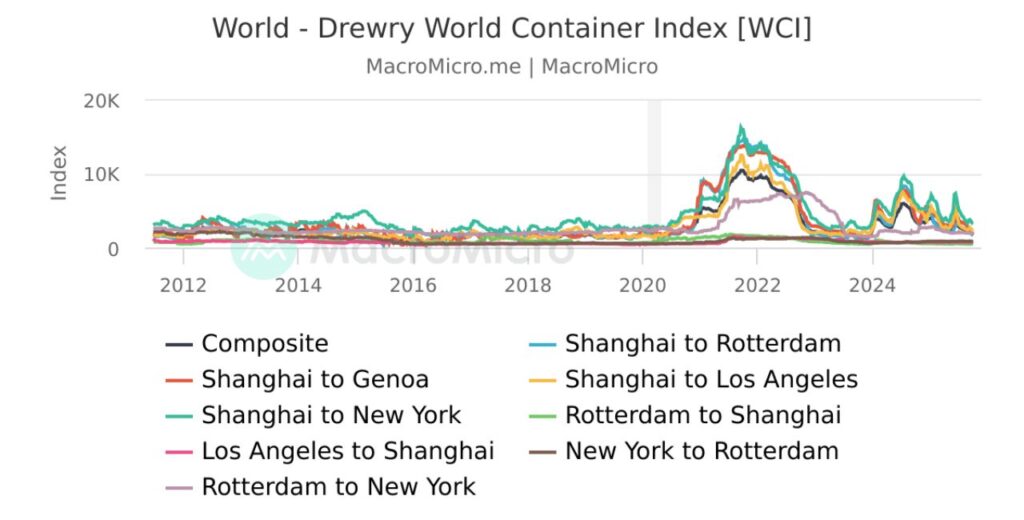
Drewry launched the index amid rising globalization. Early years showed steady growth, driven by expanding trade. By 2015, rates hovered around $1,000 to $2,000 per container.
The 2020 pandemic disrupted patterns. Rates soared to over $10,000 in 2021 due to shortages and demand surges. Ports clogged, and ships delayed, pushing costs up.
Recovery began in 2022, with rates falling sharply. By 2024, the index dipped below $2,000 again. Factors like overcapacity and weaker demand played roles.
Entering 2025, declines continued through summer. Experts predicted further drops, but October shifted the narrative. This turnaround caught many by surprise.
Historical peaks and troughs teach lessons. High rates strain importers, while lows benefit consumers. The index captures these cycles, aiding long-term planning.
Methodology Behind the Index
Drewry collects data from multiple sources. They survey freight forwarders and shippers weekly. This ensures fresh insights into market conditions.
The index covers specific routes:
- Shanghai to Rotterdam
- Shanghai to Genoa
- Shanghai to Los Angeles
- Shanghai to New York
- And others like Rotterdam to Shanghai
Each route contributes to the composite. Drewry weights them based on trade volumes. This balances the global picture.
Updates occur every Thursday. The firm publishes changes in percentages and dollars. They also note influencing events, like strikes or weather.
Transparency builds trust. Drewry shares methodology details on their site. Users can verify calculations if needed.
This rigorous process sets the index apart from competitors. It focuses on spot markets, not long-term contracts.
Key Factors Influencing Container Rates
Several elements drive rate changes. Supply and demand top the list. When ships outnumber cargoes, prices fall.
Geopolitical tensions add pressure. Conflicts in key regions disrupt routes, raising costs. For example, Red Sea issues in prior years spiked rates.
Fuel prices matter too. Higher bunker costs lead carriers to adjust fees. Environmental regulations push for greener fuels, impacting expenses.
Seasonal demands fluctuate. Holiday peaks increase volumes from Asia. Weather events, like typhoons, delay shipments.
Economic indicators play roles. Strong GDP growth boosts trade, lifting rates. Recessions do the opposite.
Carriers’ strategies influence outcomes. Alliances control capacity, sometimes withholding ships to maintain prices.
Drewry World Container Index Oct 2025: A Detailed Breakdown
The drewry world container index oct 2025 ended a prolonged decline. Early in the month, rates hit lows, but mid-October saw gains. This section examines weekly shifts.
On October 9, 2025, the index stood at $1,651 per 40-foot container. It marked the 17th straight weekly drop. Analysts attributed this to excess capacity and soft demand.
By October 16, things changed. The index rose 2% to $1,687. This first increase in months signaled a turning point. Spot rates from Shanghai to Los Angeles climbed 1% to $2,195.
Shanghai to New York rates increased 1% to $3,236. On Asia-Europe lanes, Shanghai to Rotterdam jumped 6% to $1,669. Genoa routes rose 2% to $1,821.
Experts noted carrier efforts to push prices up. General Rate Increases (GRIs) loomed for November, influencing October sentiment.
October 23 brought more gains. The index upped 3% to $1,746. Shanghai to Los Angeles rates grew 4% to $2,290. New York routes surged 6% to $3,420.
Europe saw Shanghai to Rotterdam at $1,736, up 4%. Genoa hit $1,855, a 2% rise. These hikes reflected preparations for peak season.
Overall, October averaged around $1,700. Compared to September’s lower figures, it showed recovery. Transpacific routes led the uptick, driven by U.S. imports.
Asia-Europe lanes followed suit, amid contract talks. Carriers announced higher FAK rates for November, boosting confidence.
Route-Specific Analysis for October 2025
Breaking down by paths reveals nuances. Transpacific routes faced U.S. port strikes earlier, but October stabilized.
Shanghai to Los Angeles: Started at $2,195 mid-month, ended higher at $2,290. Demand for consumer goods drove this.
Shanghai to New York: From $3,236 to $3,420. East Coast ports handled more volume, pushing rates.
Asia to Europe: Rotterdam rates from $1,669 to $1,736. Genoa from $1,821 to $1,855. European economies showed slight improvement.
Backhaul routes, like Europe to Asia, remained low. Rotterdam to Shanghai hovered around $300-400, reflecting imbalances.
Other lanes, such as intra-Asia, saw minimal changes. The index focuses on major trades, but these affect overall capacity.
Comparisons to Previous Months
September 2025 saw the index at $1,700 early, dropping to $1,651 by October’s start. October reversed this, averaging higher.
Versus August: That month averaged $2,000, showing steeper falls before October’s rebound.
Year-over-year: October 2024 rates were around $3,000, post-summer peaks. 2025’s lower figures indicate market cooling.
Historical context: Post-2021 highs, 2025 levels resemble pre-pandemic norms. This reassures shippers of returning stability.
Factors differing from prior months: Less disruption from weather, more predictable demand. Carriers adjusted fleets accordingly.
Impacts on Global Trade
Rising rates in drewry world container index oct 2025 affected importers. Higher costs passed to consumers, potentially inflating prices.
Logistics firms adjusted strategies. Some locked in contracts early, avoiding spot volatility.
Exporters benefited from backhaul imbalances. Low return rates kept overall expenses manageable.
Industries like retail felt the pinch. Holiday preparations amplified October’s importance.
Automotive and electronics sectors monitored closely. Supply chains rely on timely, affordable shipping.
Broader economy: Stable rates support growth. October’s uptick suggested confidence in recovery.
Forecasts and Future Trends
Drewry predicted weakening supply-demand in quarters ahead. Despite October gains, rates might contract.
November saw continued rises, reaching $1,822 by early month. This built on October momentum.
By December 2025, the index hit $2,213, showing sustained growth. January 2026 surged to $2,557, driven by transpacific hikes.
Experts foresee volatility from new regulations. Emission rules could add costs.
Trade policies, like tariffs, pose risks. U.S.-China relations influence major lanes.
Positive signs: Global growth projections for 2026 at 3%. This could bolster demand.
Shippers should diversify routes. Using alternatives like rail mitigates sea rate swings.
How Businesses Can Use the Index
Companies track the index for budgeting. It informs when to book shipments.
Steps to leverage it:
- Monitor Weekly Updates: Check Drewry’s site for fresh data.
- Compare Routes: Select cost-effective paths based on rates.
- Negotiate Contracts: Link deals to index for protection.
- Analyze Trends: Spot patterns for long-term planning.
- Consult Experts: Use advisors for deeper insights.
Tips: Build buffers for surges. Diversify suppliers to reduce risks.
Quotes from experts: “The index provides a clear view of market pulses,” says a Drewry analyst.
Challenges in the Shipping Industry
Overcapacity remains a hurdle. New ships enter fleets faster than demand grows.
Labor issues, like strikes, disrupt flows. October avoided major ones, aiding recovery.
Environmental pressures mount. Carriers invest in green tech, raising base costs.
Digitalization helps. Tools track rates in real time, improving decisions.
Geopolitical risks persist. Conflicts reroute ships, extending voyages.
Resilience strategies: Stockpile key goods, use multi-modal transport.
Case Studies from October 2025
A U.S. retailer faced rising transpacific rates. They shifted some cargo to air, balancing costs.
European importer negotiated fixed contracts pre-October hike. This saved thousands.
Asian exporter used low backhaul rates to expand markets. October’s stability encouraged investments.
These examples show proactive use of index data.
Statistics and Data Highlights
- Average October 2025 index: ~$1,700 per 40ft.
- Peak weekly rise: 3% on Oct 23.
- Route highs: Shanghai-New York at $3,420.
- Year-low comparison: Down 40% from 2024 peaks.
- Global trade volume: Up 2% YoY in Q4 2025.
Data sourced from Drewry reports and news.
For broader market views, check NASDAQ indices for related financial trends.
SEO Optimization Tips for Shipping Pros
Incorporate index tracking into SEO strategies. Keywords like freight rates help visibility.
Use tools to monitor search trends. Align content with rate updates.
Link to authoritative sources for credibility.
FAQs
What does the drewry world container index oct 2025 indicate?
It shows spot rate trends, highlighting a shift from declines to modest gains.
How often does Drewry update the index?
Weekly, every Thursday.
Which routes influence the index most?
Major ones from Shanghai to Europe and U.S. ports.
Can businesses predict future rates using this?
Yes, with trends and forecasts from Drewry.
Where to find more details?
Visit official sites like Drewry’s expertise page.
Conclusion
The drewry world container index oct 2025 captured a crucial market pivot, with rates rising after prolonged falls. This offered reassurance amid uncertainties, helping businesses navigate costs. Key takeaways include route-specific hikes and emerging stability.
In summary, October’s data underscored recovery potential, influenced by carrier strategies and demand. Professionals can use these insights for smarter decisions.
What strategies will you adopt based on the drewry world container index oct 2025 trends?
References:
- Drewry Official Site – Provides weekly index updates and methodology. Ideal for logistics managers seeking benchmarks.
- Security Cargo Network – Details rate changes and forecasts. Useful for cargo handlers tracking spot markets.
- Hellenic Shipping News – Covers weekly increases with route breakdowns. Suited for shipping news enthusiasts and analysts.