
Quick answer: A stock quote shows the current price, the day’s change, the trading range, volume, market capitalisation and valuation numbers like the P/E ratio. Price tells you what the market pays today; P/E and market cap help you judge whether that price is high or low for the company.
- 100% free
- Call direct
- Voice search
- Urdu & English
Stock pages are full of numbers and abbreviations that confuse new investors. This guide explains each part of a stock quote in plain English, with examples, and a free calculator that works out P/E, market cap and dividend yield from a few numbers. This is education, not investment advice.
What Is a Stock Quote?
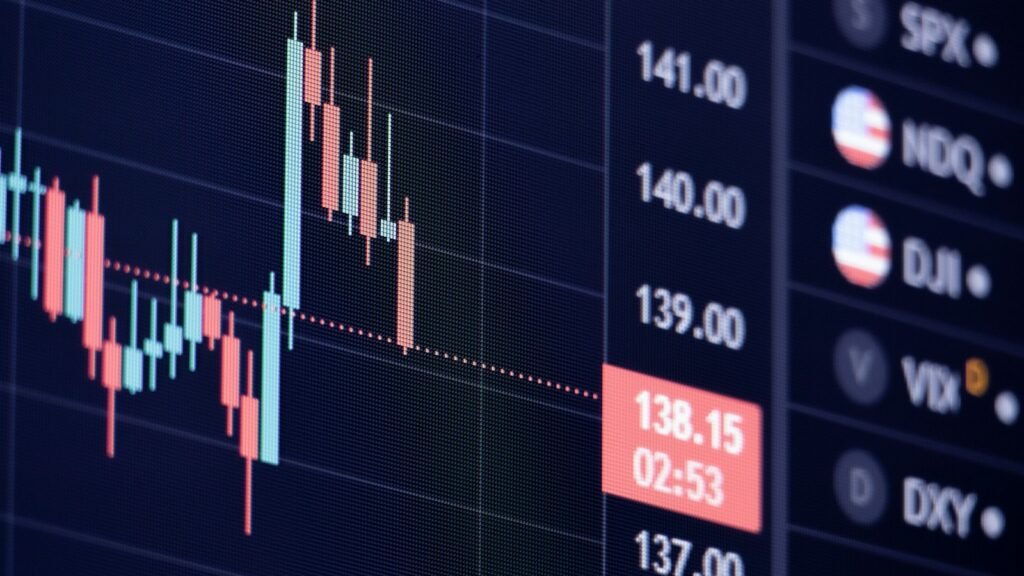
A stock quote is a snapshot of a company’s share price and key trading data. You will see it on finance websites, broker apps and news pages.
- Ticker: the short code for the company, like AAPL for Apple.
- Last price: the most recent trade price.
- Change: how much the price moved today, in money and per cent.
- Bid and ask: the best prices buyers offer and sellers want.
Key Numbers on a Stock Quote
| Number | What it means | Why it matters |
|---|---|---|
| Day’s range | Lowest and highest price today | Shows today’s volatility |
| 52-week range | Low and high over the past year | Where the price sits versus the year |
| Volume | Shares traded today | Higher volume can mean more interest |
| Market cap | Price × shares outstanding | Company size |
| P/E ratio | Price ÷ earnings per share | How much you pay for each unit of profit |
| Dividend yield | Annual dividend ÷ price | Cash return from dividends |
How to Read a Stock Quote Step by Step
1. Check the price and change
Start with the last price and today’s move. Big daily moves often follow news or earnings.
2. Look at the ranges
Compare today’s price with the 52-week high and low to see the bigger picture.
3. Check market cap
Market cap tells you the company’s size. Large companies are often steadier; small ones can move more.
4. Read the P/E ratio
Compare the P/E with similar companies. A much higher P/E usually means investors expect faster growth.
Free Stock Quote Calculator
Enter a few numbers from any stock quote or annual report to calculate P/E, market cap and dividend yield. Nothing is saved.
P/E, Market Cap and Yield Calculator
Use the same currency for all values.
Types of Prices You May See
- Real-time price: live during market hours, common in broker apps.
- Delayed price: some free sites show prices delayed by a few minutes.
- Pre-market and after-hours: trades outside normal hours, often with lower volume.
- Previous close: the last price from the prior trading day.
Who Should Learn This?
- New investors: understand what you are looking at before you buy.
- Students: learn basic finance terms used in business news.
- Small business owners: follow suppliers, customers and competitors that are listed.
Limits and Risks
- A low P/E can mean a bargain or a business in trouble.
- P/E is not useful for companies without profits.
- Quotes show the past and present, not the future.
- Investing involves risk; you can lose money. The SEC’s Investor.gov has free beginner guides.
How to Get Started
- Pick a finance website or broker app you trust.
- Search the company’s ticker.
- Read price, change and ranges.
- Check market cap and P/E.
- Compare with similar companies.
- Read the latest company news before deciding anything.
Frequently Asked Questions
What is a good P/E ratio?
There is no single good number. Compare it with similar companies and the company’s own history.
What does market cap tell me?
How large the company is in market value: share price multiplied by shares outstanding.
Why is the price different on two websites?
One may be real-time and the other delayed, or one may show after-hours trading.
What is volume?
The number of shares traded during the day.
What is dividend yield?
The annual dividend per share divided by the share price, shown as a percentage.
Is a falling price always bad?
Not always. It depends on why it fell and how the business is doing.
Final Thoughts
- Price is only the starting point.
- Use P/E, market cap and ranges for context.
- Always compare with similar companies.
Explore More
- More Finance Tips
- Business News
- For simple guides on AI and fintech tools, visit TechWiseToday.